What we’re about to do here doesn’t come easy. But I’ll do it anyway. When we started this company, we knew that Transparency and Honesty were going to be among our core values. As trivial as this may sound, when asking people to come up with words associated with insurance, Transparency and Honesty are not among the ones you’ll hear.
At Lemonade, everything we make embodies these core values (and more, which I’ll share in future posts). It starts with our brand identity: white, hollow line art, big text, plain English, clear call to action — continues with our apps which make buying insurance feel like a friendly conversation, and down to the way we designed our customer care experience.
So, with that in mind, I’d like to share what (I’m guessing) no insurance company has ever shared before: Some of the most interesting stats we gathered during our first 48 hours on air!
Before looking at the data, please keep in mind:
1. The numbers you’ll see are only from the first 48 hours
2. We’re not a dating app, a social network or a game so there’s no network effect at play here (yet)
3. We’re currently available in NY State only (check out our progress at Lemonade Goes Nationwide)
Now that I lowered your expectations, I‘m more comfortable diving into the numbers.
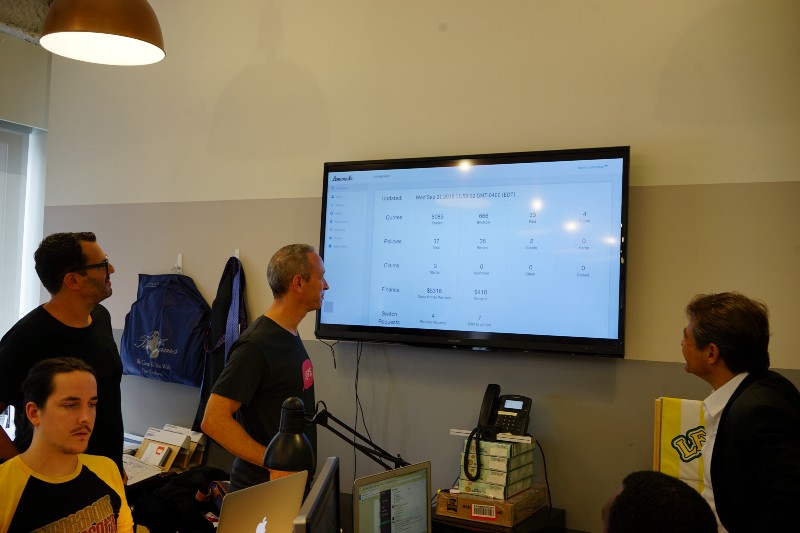
Looking at the numbers, just hours after the launch with Daniel and Peter Diamandis.
Traffic
Lemonade was the first insurance company on the planet to launch on Product Hunt. The PH launch by itself was a message to our users and the industry:
PH proved to be a great source of traffic, with an almost equal amount of homeowners and renters in California and NY. Since we only offer our insurance in NY State, a significant portion of the traffic that hit us couldn’t convert. That put some pressure on our conversion rates, but regardless, the positive noise coming from California was tremendous, resulting in tons of comments, tweets, and shares.
Demographics
Research conducted by our team shows that insurance is mostly purchased by guys (ladies… time to change this!) and the traffic we received proved this true. 82.64% of our visitors were male and 17.36% female. But it also shows that this data could have been skewed because our Product Hunt visitors were mostly male (88.89% male, 11.11% female). Is Product Hunt traffic 90% male!?
With the decline of the PH effect, our demos started to even out at 74% male vs. 26% female. We also noticed that female users spend about 9.1% more time on our site and dig deeper into content than their male counterparts.
Let’s talk about age. It’s easy to tell by our brand and tone of voice, that we’re considering the 22–40 y.o. group as our early adopters. This is reflected in our messaging, colors and down to the media outlets that covered our launch. It was super exciting to see the response from this age group, but we also got some nice surprises.
As you can see from the charts below, the mass of NY renters are 20–40 somethings, with homeowners from early to mid 30’s.
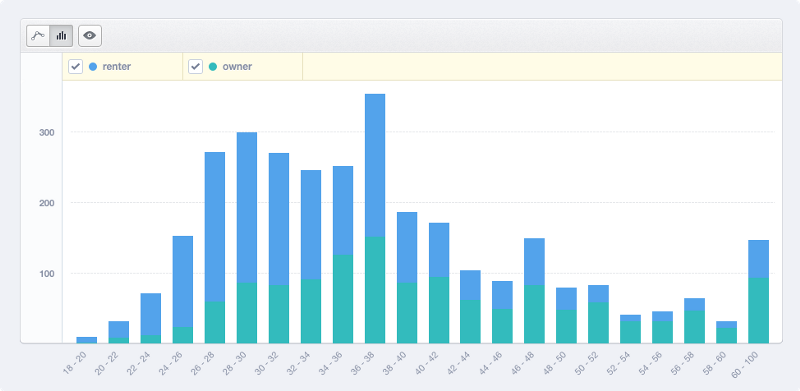
Renters (blue) and owners by age. Mostly as expected, but look at the bar on the right 😉
Conversion
The first thing we noticed early on was that although our traffic was mostly coming from media coverage, Hacker News, and Product Hunt (non-targeted, low intent) our conversion stabilized at 14.8% — from quote to payment.
Looking at our homepage performance, further up the funnel, we have our primary Call To Action button which gets users to the pricing flow. Our conversion on this page went through the roof with almost 30% Click Through Rate (CTR). I believe that the brand colors (or lack of) and the glorious pink button help users focus on a single, clear action to take.

Switching
‘Switching’ is a feature we created that allows users who are already insured with other carriers to cancel their policies, get a refund and buy a new policy from us with a click of a button.
It’s exciting to see people choosing Lemonade over America’s most respected insurance companies! People left State Farm (22%), Allstate (18%), GEICO (14%) and many others to come to us (holy crap!!).
Moving forward, we see this as an important success factor for our growth.

Customer Care war room. Overwhelmed by the love and support coming from all over the world.
Revenue
Second reminder: these numbers represent our first 48 hours on the market.
Weeks before the launch we asked the team to bet on some of our metrics such as the number of policies sold on the first day. For lack of better information, we wanted to use this as a baseline to determine the success of the launch. It’s far from scientific, but sometimes you need to go with what you have.
In reality, we ended up selling 4X more than the most optimistic bet, with $14,302 GPW (Gross Premium Written, the equivalent of ARR in subscription services).
We currently offer three different policies: Renters (your stuff + liability), Condo (apartment + your stuff + liability), and full Homeowners (entire home + your stuff + liability). The average Renters policy gross premium sold in the first 48 hours was $86.25 ($7.1 per month), the average Condo was $528 ($44 per month) and Homeowners was $691 ($57 per month).
It’s interesting to see that in the past two weeks, our average Homeowners policy grew to $1,120 ($93 per month).
Enjoy!