A few months ago, shortly after launching Lemonade, we did something unexpected – we shared our metrics and performance from the first 48 hours since our launch (Part 1 in our Transparency Chronicles).
It didn’t come easy. Exposing such sensitive information is counterintuitive, but we thought it’s important in our quest to make insurance an open, trusted and honest experience.
Today, in Part 2 our 2016 Transparency Chronicles, I’m sharing interesting metrics from our first quarter in market – Q4 of 2016.
Since we’re growing fast, most of the stats I’m about to share no longer represent what we’re seeing on our screens today. So, let’s start with a taste of where we are now:
January 2017 started off with a bang! In the past week alone, we insured 410 new homes, almost the number of homes we covered throughout the entire month of December.
Our loss ratio is (still) looking great (watch out for John Peters’ underwriting report coming out next week) and more people are leaving their old insurance companies to switch to Lemonade.
People are still curious about our app, and continue to play with it over and over again. Since launch, some 943 users started a claim just to get a feel of the experience!
Back to 2016. Let’s rewind…
We’re just starting
The challenge with radical transparency is living up to expectations, especially after a big launch.
Take, for example, an imaginary company that starts off by selling an average of 1.5 items per day. In each consecutive month, the team increases sales by 50% (in the second month they sell 2.25 items, 3.37 in the third, and so on).
As insignificant as this may sound, math has a tendency to surprise. And so, by the end of their second year, they will reach a staggering daily average of 16,834 items, or 6,060,276 items per year! (1.5²⁴ * 30* 12)
Of course, increasing sales by 50% MoM is difficult and pretty uncommon. But this example shows why it’s critical to track the right KPIs, and look for exponential growth patterns, instead of absolute figures.
Ray Kurzweil explained it well:
“Our intuition about the future is linear. But the reality of information technology is exponential, and that makes a profound difference. If I take 30 steps linearly, I get to 30. If I take 30 steps exponentially, I get to a billion.”
In recent weeks we’re seeing signs of exponential growth (300% MoM), but that obviously can’t last forever.
A smiley curve
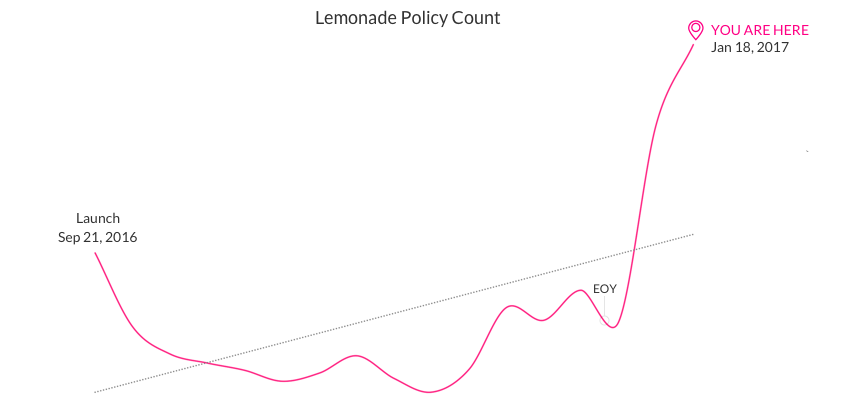
I believe it was Paul Graham who coined the term ‘Startup Curve.’ Paul used it to describe the rollercoaster most products experience – from Hype to Reality and (hopefully) to Scale.
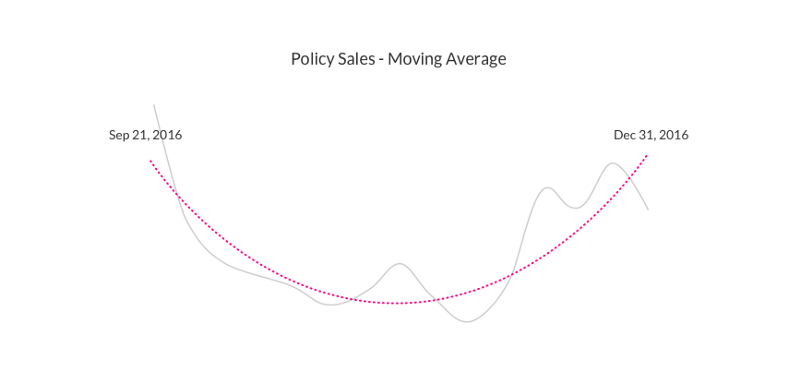
We witnessed a condensed version of that curve, which lasted approximately 90 days. It started on the day of our launch, with a sharp spike in traffic and sales. This was the Hype phase. After a few days, as the impact of media coverage faded, we arrived at our Reality phase, selling a very small number of policies a day. However, by December, we regained our momentum as an upward Scale trend started to form.
Business highlights
In the last weeks of 2016, we covered 1,212 homes in NY alone (estimated total of 1,350,000 sq. ft.). This translates to $186,389 of premium and an annual run-rate of over $1M.
The average premium for a Lemonade policy was $165.50 for renters and homeowners. Speaking of homeowners, these folks bought 123 policies (~10% of our policies, and approx. 50% of our revenue).
Similar to what we saw in the first 48 hours, the majority of our customers are urban dwellers who live in the heart of the concrete jungle. Demographics stayed true to their form as well, with 81% of our customers falling between the 25–44 age group.

Snapshot taken from one of our live monitors in the office (pink – renters, blue – condo, purple – homeowners)
On the gender front, we’re happy to see a growing female interest, with 23.5% female policyholders and 25.6% female visitors, representing a growth of 45.4% from our launch day.
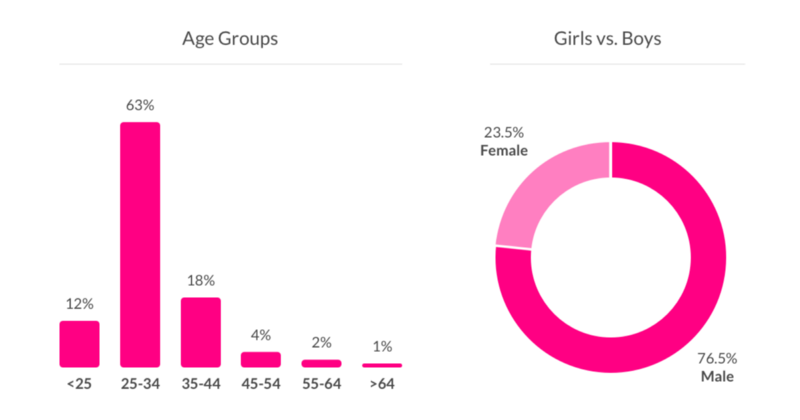
Lemonade customer demographics, 2016
Switching
We constantly track where our new customers are coming from. We check if they had a previous insurer and who they were insured with. Customers love our hassle-free switching process, which is done with a click of a button, so to speak (AI Maya asks you if you’d like to switch, and magically handles everything for you!).
Here’s where people switched to us from:
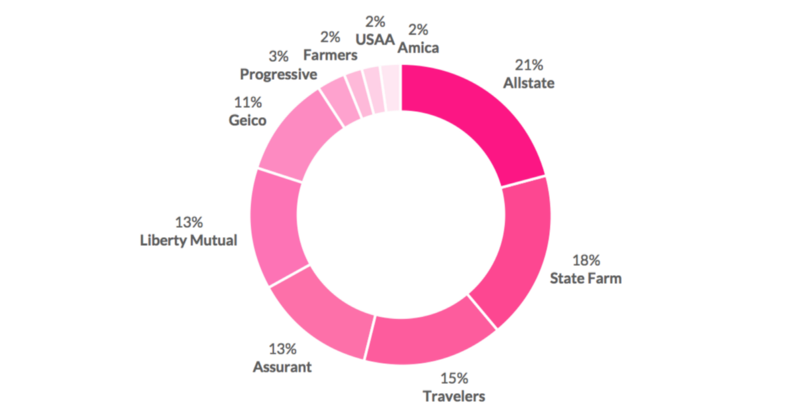
Customers are leaving incumbents to join Lemonade
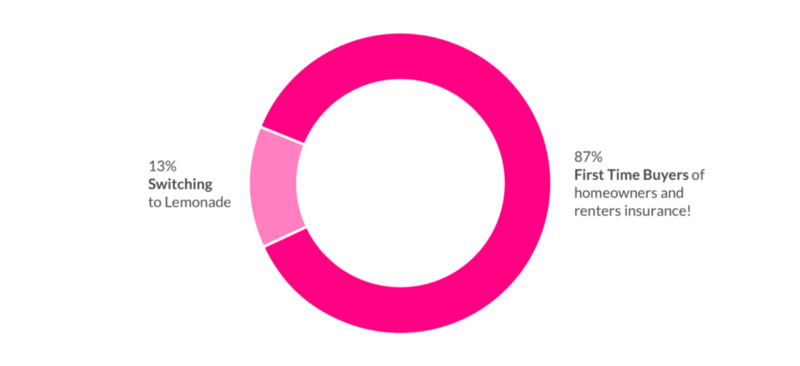
When we compare new users who switched to us from other insurers vs. those who bought insurance for the first time, we see some pretty amazing results.
Approx. 87% of our customers bought their first home insurance product through Lemonade!
Claims are fun!
We had the pleasure of handling 6 claims in 2016, and boy, was that fun! We happily paid out $4,589 to Lemonade customers.
But there’s one claim that really got our attention. This one helped us break a world record: the first time ever that a claim was handled solely by AI – from triage, through fraud mitigation and down to the actual payment by wire. Start to finish, without involving us humans, all done by AI Jim!
But the coolest part about this claim? It was approved and wired in 3 seconds!

Yup. We measure instant claims in seconds, not weeks or months. In fact, our team only found out about the entire thing after it was over 🙂
[What happened here, exactly? Read how Lemonade broke an insurance world record.]
Humans, they’re still pretty useful sometimes
Our customer care team handles insurance inquiries, product feedback and general questions, and they do this with truckloads of love and patience. We invest most of our time in perfecting the user experience, whether it’s through our app or with one of our human team members.
We push ourselves to respond to inquiries in a matter of minutes, but sometimes during peak times we suffer delays, and that’s when our response times suck. We’re working hard to improve this very soon.
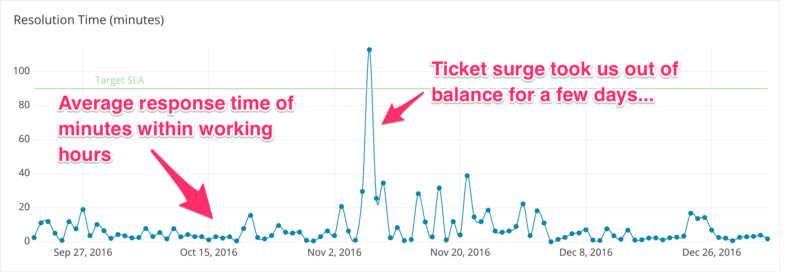
Capture from our Customer Care BI platform
What didn’t work: P2P
If I had to choose one thing that didn’t work as we had hoped, it’s our use of P2P to describe what Lemonade is. We looked for a term that would encapsulate our ideas around affinity groups, Giveback and the fact that we don’t treat customers’ premiums as ‘our money.’
[Btw, Giveback is where we give unclaimed premiums to charities. Learn more about Lemonade’s Giveback.]
In retrospect, it created a lot of confusion. People seem to read so many different things into this term, so we now describe ourselves using phrases like AI and Behavioral Economics.
Call it what you may (and we get it, P2P wasn’t a winner) but in a nutshell, Lemonade is a tech company doing insurance, and not an old insurance company with an app.
Company updates
By the end of 2016 we secured a total of $60M in three financing rounds. The first round was a $13m seed investment by Aleph and Sequoia (late 2015), the second was another $13m from XL Innovate and existing investors, and our most recent round of $34m by General Catalyst, GV (formerly known as Google Ventures), Thrive, Tusk Ventures, and existing investors.
In December ‘16 we had approx. $52m in the bank (including surplus). We were lean with our expenses throughout the year and it shows in the numbers.
Here’s a peek into one of our bank accounts:
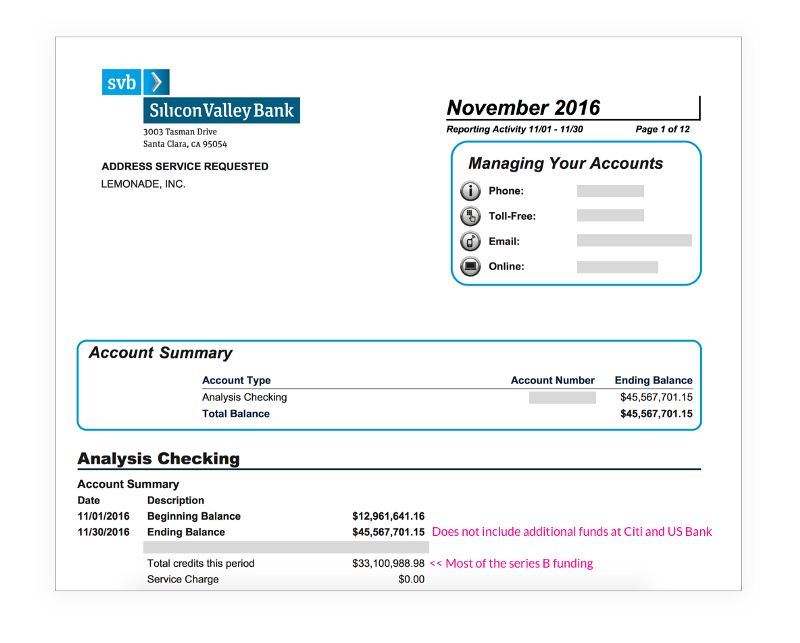
This is a real statement page (with minor censorship)
We doubled our team and announced some key members including: Prof. Dan Ariely as our Chief Behavioral Officer, John Peters as Chief Underwriting Officer, and Bill Latza as General Counsel.
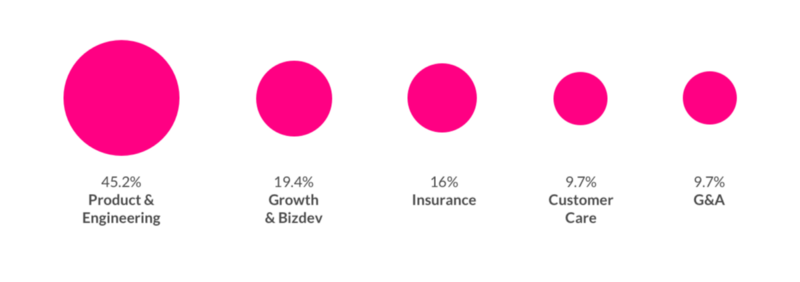
As a product-focused company, we constantly invest in innovation, product improvement, automation and customer experience. Here’s how our team is structured (today):
2017 – building for scale
Towards the end of the last quarter we spent a lot of time in preparation for our ongoing nationwide expansion.
In 2017, we’ll continue to focus on expansion on all fronts – product, geography, and within our organization. We’ll be launching revolutionary new products (can’t wait to show you what’s coming…), continue to develop our AI and gradually launch new states, allowing more people to enjoy a cool dose of Lemonade.
Stay Safe,
Shai
– – –
Update: you can now read up on Lemonade’s 2017 year in review