Did you know that in the United States, seven out of every 10 households own a pet?¹ From unconditional love to emotional support, pets are a vital part of their owners’ lives. Many care for their pets as if they’re family members.
This is hardly limited to America, though. We’ve set out to compile the definitive list of pet ownership statistics in the U.S. (and worldwide) to show how the bond between humans and animals transcends continents and languages.
Read on to learn everything you need to know about what pet ownership looks like across the world. It’ll warm your heart-and it might just come in handy for your next trivia night.
Pet ownership has grown steadily in the U.S. over the years. While dogs are the most popular pet overall-woof woof, keep it up-there is plenty of diversity in pet ownership.
70% of U.S. households (90.5 million homes) owned a pet as of 2022.¹
69 million U.S. households have a pet dog, compared to 45.3 million with a cat.¹
3.5 million American households own a horse, and 2.9 million own a saltwater fish.¹
From March 2020 to May 2021 alone, roughly 1 in 5 U.S. households acquired a dog or cat.³
Pet ownership has steadily risen in the U.S: 56% of households owned a pet in 1988, compared to 67% as recently as 2019.¹
Let’s dive a bit deeper to see pet ownership trends by state.
Pet ownership statistics by state
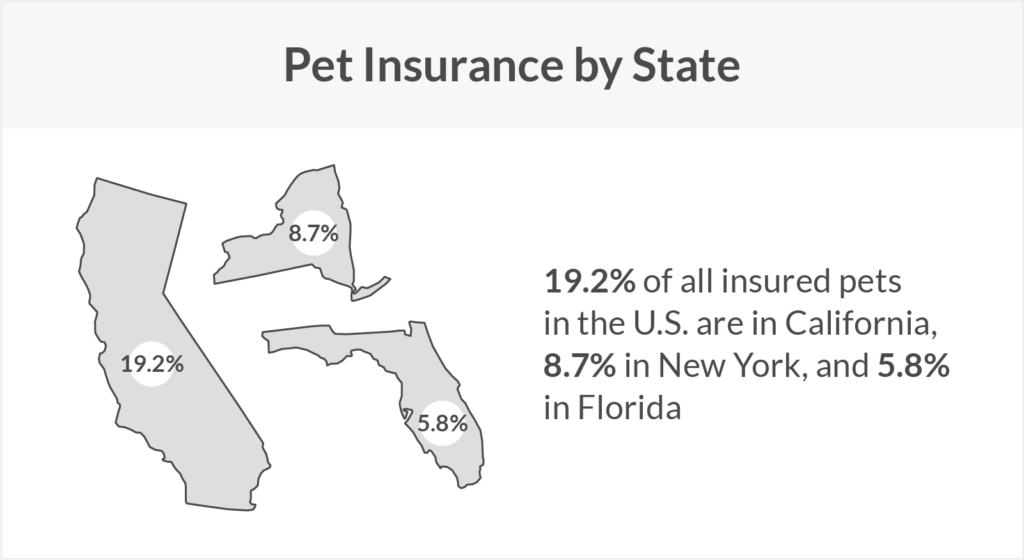
When breaking down some stats by state, we find some particularly interesting details. Who knew that Californians loved pet insurance so much, or that residents of D.C. weren’t in much need of furry friends?
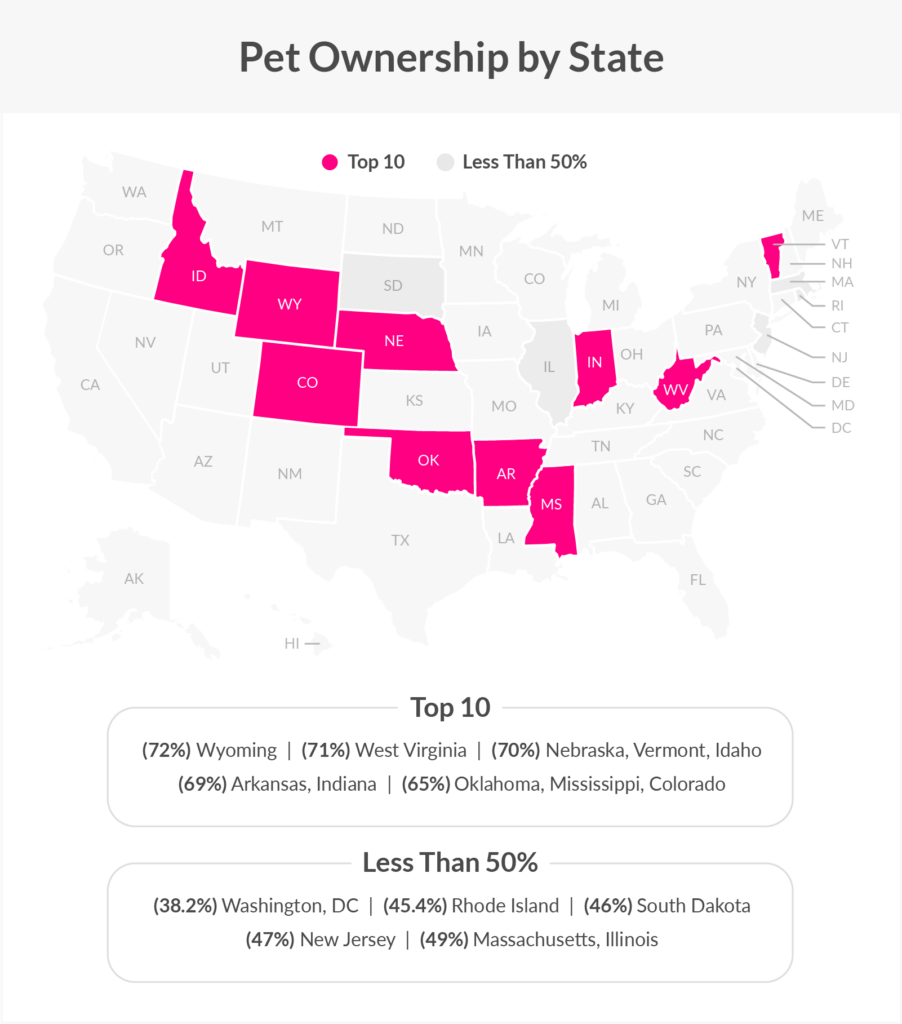
Wyoming is the #1 pet-owning state, with 72% of households owning at least one pet.²
Following WY, the top 10 states with the highest percentages of pet-owning households are: West Virginia (71%), Nebraska (70%), Vermont (70%), Idaho (70%), Arkansas (69%), Indiana (69%), Oklahoma (65%), Mississippi (65%), and Colorado (65%).²
Washington, D.C. (while not technically a state) has the lowest percentage of household pet ownership (38.2%), followed by Rhode Island (45.4%).²
Less than half of households own pets in the following states: South Dakota (46%), New Jersey (47%), Massachusetts (49%), and Illinois (49%).²
Now, let’s buckle up and take a ride through what pet ownership looks like around the world.
Worldwide pet ownership statistics
Looking at Asia, Europe, Latin America, and Oceania, we see that preferred pet companions vary quite a bit by country and region.
Spoiler alert: Reptiles are crushing it in the U.K., while dogs aren’t so popular in Turkey. Cats, meanwhile, are faring well in Europe-especially in France, where they’re about twice as common as pet dogs. C’est pas croyable!
As of 2020, 38% of all European Union households (88 million homes) owned at least one pet.⁵
There are roughly 110.15 million pet cats throughout Europe, making it the #1 household pet on the continent.⁵
In Europe, Turkey has the lowest percentage of households with a pet dog, at just 5%.⁵
Italy has roughly 1.37 million pet reptiles, making it the second-largest pet reptile population behind the U.K. (1.45 million) in the region.⁵
Italy also has the largest pet ornamental bird population in Europe (12.88 million).⁵
By total, ornamental birds are the most popular pet in Italy (12.88 million) ahead of dogs (8.3 million) and cats (7.93 million).⁵
By total, ornamental birds are the most common pet in Spain (6.99 million), ahead of dogs (6.73 million) and cats (3.8 million).⁵
With just 11% of households owning at least one pet cat, Spain also has the lowest percentage of cat ownership in Europe.⁵
Turkey has the second-largest pet ornamental bird population in Europe (11.2 million), while Spain has the third largest with 6.99 million.⁵
France has twice as many pet cats (15.1 million) as pet dogs (7.5 million).⁵
Among EU countries, Romania has the highest percentage of households with pet cats (47%).⁵
Among EU countries, Romania is also tied with Poland for the highest percentage of pet dogs (42%).⁵
In 2021, 33% of United Kingdom households (12.5 million) owned a pet dog, while 12.2 million owned a pet cat (27%), and 500,000 owned a pet pigeon (0.8%).⁶
32% of households in Asia-Pacific (APAC) countries* own a dog, compared to 26% who own cats.⁷
16% of Hong Kong households own a dog, compared to 47% in Thailand.⁷
In APAC, the Philippines has the highest rate of dog ownership (67%).⁷
Cats are the top pet in Indonesia, with 47% of households owning one.⁷
Japan has the lowest rate of pet ownership in APAC, where 72% of households don’t own any pets.⁷
15% of households in Vietnam own a pet goldfish, the highest percentage in APAC.⁷
As of 2020, 64% of New Zealand households owned a companion animal.⁸
Cats are the most popular pet in New Zealand, with 41% of households owning at least one.⁸
While only 9% of New Zealand households have pet fish, there are more pet fish (1.37 million) than cats (1.2 million) and dogs (851,000).⁸
61% of Australian households have a pet (5.9 million).⁹
Pets outnumber people in Australia – roughly 29 million pets vs. 25 million people.⁹
Roughly 40% of Australian households have at least one dog, followed by cats (27%), fish (11%), and birds (9%).⁹
As of 2019, Brazil has the world’s fourth-largest pet population with 132 million pets (including 77 million dogs and cats.)¹⁰
Cats vs. Dogs: The Battle Continues
No study of pet ownership would be complete without exploring the rivalry between cats and dogs. Here’s how cat and dog ownership stack up in the U.S., with a special focus on adoption factors.
As of 2016, 85% of households with dogs consider their dog to be a family member, compared to 76% of households with cats.²
Roughly 40% of dog owners and 46% of cat owners found their pet through word of mouth.¹¹
Approximately 31% of cat owners obtained their pet via an animal shelter/humane society, compared to 23% of dog owners.¹¹
34% of dog owners obtained their pet via a breeder, compared to just 3% of cat owners.¹¹
27% of pet cats were once strays, compared to 6% of pet dogs.¹¹
Approximately 2 million shelter dogs and 2.1 million shelter cats are adopted in the U.S. each year.¹¹
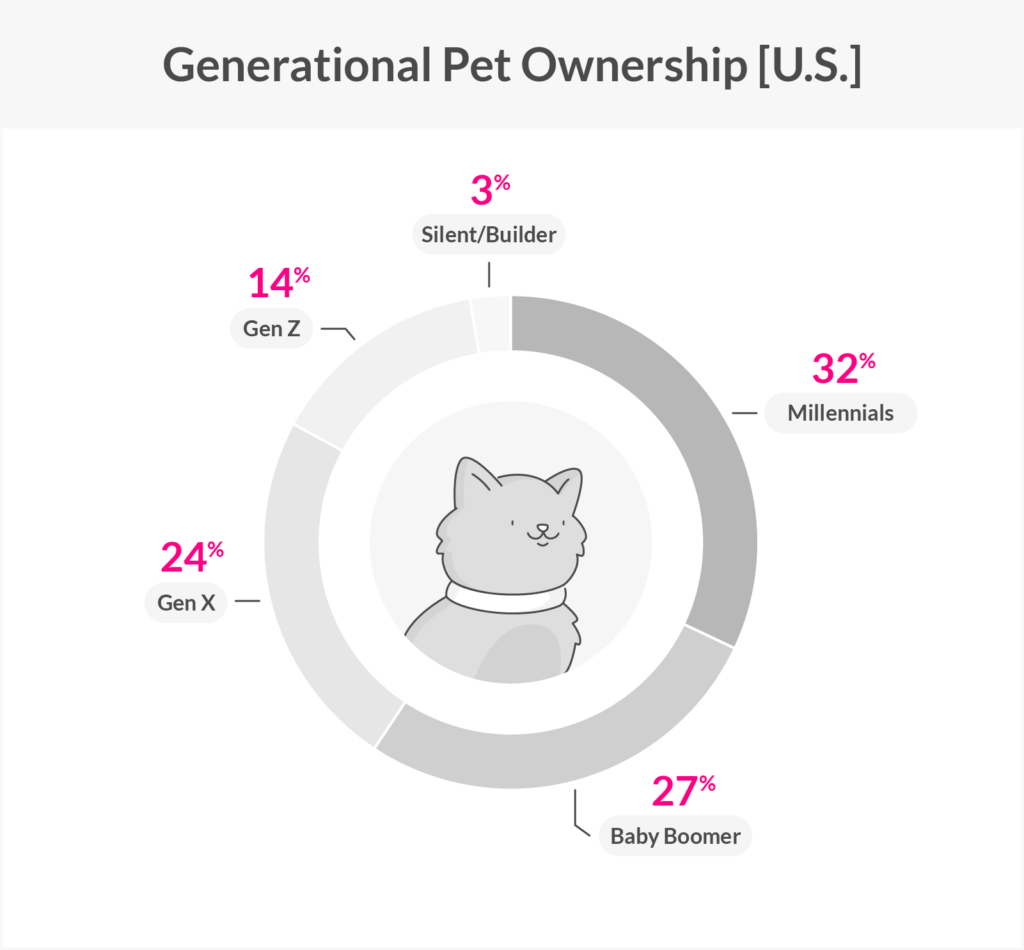
The generation divide among pet parents
So far we’ve given the animals plenty of attention. But is there more we can learn about pet owners? For example, how does pet ownership vary along generational lines in the U.S.? Here’s what the latest data shows.
Pet ownership expenses
From food to toys to veterinary visits, here’s what the cost of pet ownership looks like in the U.S.
American pet owners spend the most on pet food and treats: $42 billion in 2020.¹
U.S. pet owners were estimated to spend $9.7 billion in 2021 on services other than veterinary needs, including insurance, grooming, training, and boarding.¹
In 2020, the U.S. spent $31.4 billion on vet care & product sales, which was projected to grow to $32.3 billion by 2021.¹
Americans spent $22.1 billion on supplies, live animals, and over-the-counter medicine in 2020.¹
According to the U.S. Bureau of Labor Statistics, the average American spent just over $500 per year on their pets in 2011.¹²
Total pet industry expenditure
As pet ownership has steadily grown in the United States, the data shows that pet industry expenditures have increased as well.
In 2021, pet expenditures were projected to reach $109.6 billion in the U.S. alone.¹
From 2010 to 2020, U.S. pet industry expenditure grew by 114%.¹
In 2020, the U.S. spent $103.6 billion on the pet industry**.¹
In 2018, total U.S. pet industry expenditures were $90.5 billion, compared to $97.1 billion in 2019.¹
U.S. pet industry expenditure grew by 6.69% from 2019 to 2020.¹
Based on estimates, U.S. pet spending on services outside of vet care grew by 16.5% from 2020 ($8.1 billion) to 2021.¹
Health benefits of animal companionship
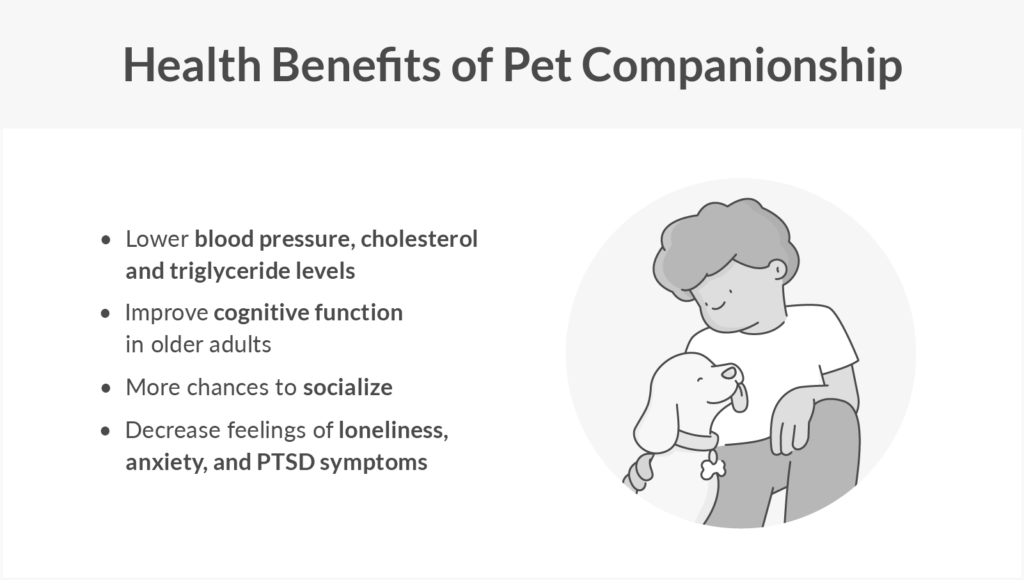
Most pet owners would probably tell you that their pet improves their lives. But did you know that data shows tangible health benefits of animal companionship?
According to the Centers for Disease Control and Prevention, pets can help manage loneliness and depression with their companionship.¹³
Regularly walking or playing with a pet can decrease blood pressure, cortisol levels, and triglyceride levels.¹³
Animals can provide emotional support and decrease feelings of anxiety and symptoms of PTSD.¹³
For older adults, regular outdoor activities with pets can improve cognitive function.¹³
As of 2020, there were 118,624 licensed veterinarians in the U.S., which means the ratio between U.S. households with dogs and veterinarians is approximately 582:1.¹⁴
The ratio between the number of U.S. households with cats and total veterinarians in the U.S. is approximately 382:1.¹⁴
On average, dog owners spend more than twice as much (127.9%) as cat owners for surgical vet visits ($458 per visit vs. $201).¹
Dog owners spend 36% more per routine vet visit than cat owners on average ($242 vs. $178).¹
In the U.S., dog owners spend 72.34% more per year on vitamins than cat owners on average ($81 vs. $47).¹
As of 2016, 34% of pet dogs appeared to be overweight or obese, compared to 36% of pet cats.²
Pet health insurance statistics
Pet health care has become more expensive over the years. Fortunately, the pet health insurance industry has grown at the same time, and the right policy can help offset those costs.
Pet insurance plans vary significantly depending on the type of animal, the animal’s age and breed, and where you live. In general, cats are cheaper to insure than dogs because their health care costs are lower.
The average cost of health insurance for a cat is about $25 per month. The average cost of health insurance for a dog is about $65 per month.
However, you can find premiums as low as $14 for cats and $37 for dogs with pet health insurance providers like Lemonade.
13 tips to become a better pet parent
Hopefully your head isn’t spinning after that statistical journey through the world of pet ownership. Now, let’s change direction a bit and take a look at how to be a better pet parent in general.
Much like raising a child, there’s a lot of responsibility that comes with pet ownership. Here are some “do’s” and “don’ts” you should follow to become a better pet parent.
Do:
Create healthy boundaries with your pet, i.e., areas in your home that are off-limits
Set house rules
Offer positive reinforcement for good behavior
Clean up after your pet in public places, like the dog park or the sidewalk
Get your pet plenty of exercise and socialization
Establish a feeding schedule and healthy diet
Pay attention to any sudden changes in behavior or appetite
Schedule regular check-ups
Purchase insurance for your furry friend so you’re covered in the event of an emergency
Don’t:
Share your food with your pet
Leave your pet’s waste behind in public areas (c’mon, people!)
*APAC Countries include: China, Hong Kong, Indonesia, India, Japan, South Korea, Malaysia, Philippines, Singapore, Thailand, Taiwan, and Vietnam
**Pet industry spending categories: food, supplies, medicine, vet care, live animal purchases, grooming, and boarding
*Methodology: Figures were calculated using 2021 APPA findings on total American households with pets data and dividing the total veterinarians found in 2020 AVMA data.
Disclaimer: Lemonade pet insurance is currently available in 36 out of 50 states in the U.S. and the District of Columbia. Lemonade Pet is not currently available internationally. Check to see if you’re eligible.
Please note: Lemonade articles and other editorial content are meant for educational purposes only, and should not be relied upon instead of professional legal, insurance or financial advice. The content of these educational articles does not alter the terms, conditions, exclusions, or limitations of policies issued by Lemonade, which differ according to your state of residence. While we regularly review previously published content to ensure it is accurate and up-to-date, there may be instances in which legal conditions or policy details have changed since publication. Any hypothetical examples used in Lemonade editorial content are purely expositional. Hypothetical examples do not alter or bind Lemonade to any application of your insurance policy to the particular facts and circumstances of any actual claim.